Part 3 - From Allocation to Outcome Engineering
- Rajeev Roshan R

- 6 days ago
- 28 min read
If the first part was about structure, and the second was about judgment, this part is about completion.
Because there is a version of this journey that stops too early. The allocation is in place. The SIPs are running. The funds are selected. And the investor concludes, reasonably, that the work is done.
It is not.
A portfolio that is well-structured and intelligently positioned is still only an input. What it will actually deliver — across time, across cycles, net of costs, taxes, and the accumulated weight of every behavioural decision the investor makes along the way — that is the output.
Most investors build portfolios. Very few define what those portfolios must deliver. And fewer still have a framework for measuring whether the delivery, when it arrives, will actually be enough.
That gap — between allocation and outcome — is where most long-term financial plans quietly disappoint. Not with a dramatic collapse. With a slow, compounding shortfall that only becomes visible when it is too late to correct.
This part closes that gap.
The Final Shift — From Allocation to Outcomes
Once a portfolio is constructed, there is a natural tendency to treat it as complete. But allocation is an input, not an output. The output is what the portfolio will actually deliver — under different conditions, across different time horizons, net of everything reality applies to it.
Until that output is understood, the portfolio is operational but unexamined. Active but directionless.
The distinction matters because it changes everything the investor monitors, acts on, and ignores:
The Allocation Question | The Outcome Question |
Is my portfolio correctly structured? | Is my portfolio on track to deliver what I need, when I need it? |
Which funds am I holding? | What is the probability my goals are funded on schedule? |
What did my portfolio return last year? | Am I ahead or behind my required trajectory? |
Should I change my allocation? | Do I need to adjust contributions, timeline, or risk? |
These are not the same question. The first can be answered by looking at the portfolio in isolation. The second requires knowing the destination — the goal, the timeline, the required return — and measuring the portfolio against that destination continuously.
A portfolio is not complete until its outcome is understood — not as a single number, but as a range, a probability, and a trajectory.
Why Return Prediction Fails
Before building toward outcome thinking, it is worth being clear about why the dominant approach — predicting returns — consistently and structurally fails.
The failure is not occasional. It is architectural. Markets are systems that process information from millions of participants simultaneously. The moment a signal becomes reliably predictive and widely known, it is arbitraged away before most investors can act on it.
Why prediction breaks down:
Markets are cyclical — the asset class that leads one decade rarely leads the next
Leadership rotates, often sharply and without adequate warning
The data that should make prediction easier — valuations, earnings, macro indicators — is available to every participant simultaneously
Timing markets requires being right twice: when to exit and when to re-enter. Each decision compounds the error rate
Forecasts from well-resourced institutional research houses have a consistently poor track record when measured against actual outcomes over rolling periods
Forecasting Assumes | Markets Actually Do |
Returns are directional and trends persist | Returns are cyclical and mean-reverting |
Recent outperformers continue to lead | Leadership rotates, often at the worst moment for trend-followers |
Data and analysis predict future outcomes | Sentiment regularly overrides fundamentals in the short run |
Timing entry and exit is possible with sufficient analysis | Timing requires being right twice — compounding the error rate |
The future resembles a more extreme version of the recent past | The future surprises in the direction of the least-held expectation |
The conclusion is not that analysis is useless. Research matters. Understanding asset class behaviour matters. But the goal of analysis cannot be prediction of a specific future return. The more durable goal is structural preparation — a portfolio that performs adequately across a range of futures, not one optimised for a single predicted future that markets will almost certainly not deliver exactly.
Prediction is fragile because it depends on one specific future arriving. Structure is durable because it is designed for multiple futures simultaneously.
From Return to Probability
Once prediction is set aside, something more useful takes its place: probabilistic thinking.
The question shift:
Most investors ask: "What return will I get?"
This demands certainty from a system that cannot provide it. It sets up every investment for disappointment, because no asset delivers a fixed, predictable return across all time periods.
A more useful question: "What is the probability that my portfolio delivers what I actually need, by the time I actually need it?"
This accepts uncertainty and works within it — which is both more honest and more actionable.
How range-based thinking works:
Instead of expecting the portfolio to deliver exactly 11%, the question becomes: what is the realistic distribution of outcomes across the scenarios markets are likely to move through?
Scenario | What It Assumes | Planning Implication |
Best Case | Markets cooperate, behaviour is disciplined, compounding uninterrupted | Portfolio delivers toward upper end of structural range. Goal reached early with surplus. |
Base Case | Normal market cycles — corrections and recoveries, some behavioural friction | Portfolio delivers roughly its expected weighted average. Goal reached on schedule. |
Worst Case | Significant correction near goal date, forced redemption at wrong time, prolonged underperformance | Portfolio delivers toward lower end of range. Goal reached late, partially, or requires intervention. |

The practical implication:
If the base case delivers enough to meet the goal, and the worst case still preserves principal or delivers a workable partial outcome, the portfolio is robust. If the worst case destroys the goal entirely, the allocation must be reconsidered — not because the best case is unattractive, but because the left tail is structurally unacceptable.
The goal of portfolio construction is not to maximise the best case. It is to ensure the worst case remains liveable.
The Mathematics of Portfolio Outcomes
This does not require academic complexity. But it does require understanding three structural ideas that shape how portfolios actually behave.
The Weighted Return
Your portfolio delivers the weighted average of all its components — in proportion to their allocation at each point in time. Not the return of the best asset. Not the return of the most exciting position.

The Interaction Effect
Two portfolios can have identical weighted average expected returns and produce profoundly different experiences — depending on whether their components move together or independently.
A portfolio whose assets all move in the same direction delivers its weighted return with full volatility intact
A portfolio whose assets move differently delivers a similar weighted return with significantly lower volatility
This is the structural mechanism of diversification. Not many assets — different-behaving assets.
Non-Linear Risk
Risk at the portfolio level is not the sum of individual risks. The interaction between assets either amplifies or dampens the overall experience in ways that are invisible when examining each asset in isolation.
Asset Pair | Typical Correlation Direction | Behaviour During Equity Stress | Portfolio Effect |
Equity + Debt | Low to negative during stress | Debt tends to hold or appreciate when equity corrects sharply | Reduces portfolio drawdown without proportionally reducing return |
Equity + Gold | Low over long periods, occasionally negative during crises | Gold frequently holds or rises during significant equity corrections | Provides emotional buffer and partial portfolio protection |
Domestic + International Equity | Moderate in normal conditions, diverges during regional cycles | Different economic cycles create periodic independence | Reduces dependence on a single economic narrative |
Equity + Equity (same category) | High positive correlation | All positions fall together during corrections | No diversification benefit — adds concentration risk dressed as diversification |
Outcome Ranges — Not Point Returns
Every portfolio has an outcome range — not a single number. The width of that range is determined by the volatility embedded in the allocation, the length of the time horizon, and the consistency of the investor's behaviour through market cycles.
How portfolio type shapes the range:
Portfolio Type | Outcome Range Width | Upside Character | Downside Character | What It Requires From the Investor |
Conservative (debt-heavy, gold, higher Monetary) | Narrow | Limited | Protected | Acceptance that return is traded for certainty |
Balanced (equity-heavy with defensive buffer) | Medium | Strong over 10+ years | Meaningful correction near goal date is possible | Patience through mid-cycle corrections |
Aggressive (concentrated, single category or theme) | Wide | Extraordinary in best case | Severe in worst case | Genuine capacity to hold through the full depth of the worst case — not theoretical tolerance |

Higher return expectation does not come as a free upgrade. It comes with:
Lower certainty of outcome
Wider variance across scenarios
Longer required holding period for averages to assert themselves
Greater dependence on behavioural discipline through the periods the portfolio performs worst
Higher return expectation always comes with lower certainty. The investor who knows this in advance makes structurally different decisions than one who discovers it mid-cycle.
Scenario Thinking and Stress Testing
A portfolio evaluated only under normal market conditions has not been truly evaluated.
Stress testing is not pessimism. It is structural preparation — calculating whether the system holds under both expected load and extreme load, because a system that fails under stress was never actually sound.
The four scenarios every Indian investor's portfolio should be pre-tested against:
Scenario | What Could Happen | Structural Question to Ask | Behavioural Question to Ask |
Major equity correction (30–40%) | Portfolio drawdown, SIP stoppage risk, exit pressure | Does the non-equity allocation provide genuine stability or correlation disguised as diversification? | Will the investor hold, pause contributions, or exit? |
Unexpected liquidity need | Forced redemption of long-term positions at depressed prices | Is the Monetary Layer sized to absorb real-world shocks without breaking the long-term structure? | Is the investor prepared to hold long-term positions through short-term personal financial stress? |
Key allocation underperforms for 3–5 years | Return drag, growing impatience, reallocation pressure | Does the weighted portfolio average remain acceptable under sustained single-category underperformance? | Will the investor stay invested through multi-year underperformance in a category they chose deliberately? |
Tax or regulatory change | Post-tax return recalculated, structure partially invalidated | How much of the portfolio's tax efficiency depends on rules that could change? | Is the investor prepared to restructure without emotional disruption to the rest of the allocation? |
Two output metrics from stress evaluation:
Recovery timeline — how long does it historically take for this portfolio composition to recover from a significant drawdown? An investor with a ten-year horizon can absorb a two-to-three year recovery. An investor with a three-year horizon cannot.
Drawdown tolerance — what is the realistic maximum drawdown this portfolio could experience? Is that within the investor's genuine behavioural capacity — not stated tolerance, but lived behaviour under sustained financial stress?
A portfolio that passes stress evaluation is not one that is immune to stress. It is one whose structure allows the investor to remain invested through stress — which is the only condition under which long-term compounding actually works.
Correlation and Interaction Between Assets
The reason diversification works is not that you hold many assets. It is that assets behave differently from each other across market cycles — and that different behaviour, when combined structurally, produces a portfolio experience that is smoother and more survivable than any individual component alone.
The core idea in plain terms:
Assets with high positive correlation move together. When one falls, all fall. A portfolio built entirely of positively correlated assets is concentrated risk spread across multiple labels — not genuine diversification.
Assets with low or negative correlation move independently, or in opposite directions under certain conditions. Their combination produces aggregate volatility that is structurally lower than the weighted average of each component's individual volatility.
What this looks like in practice:
When equity corrects sharply, gold has historically held or appreciated — not always, not with certainty, but consistently enough across deep corrections to change the investor's experience meaningfully
When equity is volatile and drawdown-prone, debt delivers contractual returns that reduce the amplitude of the portfolio's swings — not by adding high return, but by stabilising the overall experience
When domestic equity underperforms due to local economic conditions, international equity sometimes follows a different cycle — reducing dependence on a single economic narrative over long periods

The practical implication:
Diversification is not measured by the number of funds held. It is measured by the number of genuinely different behaviour patterns the portfolio contains.
Four large cap funds = one source of return across four labels. No structural diversification.
One large cap fund + short-duration debt + gold + international equity = four structurally different behaviour patterns. Genuine diversification.
Diversification works because assets behave differently, not because they are many.
Rebalancing — From Discipline to Mechanism
Rebalancing is widely discussed. It is consistently undervalued. Most investors understand it as a maintenance task — periodic adjustment to restore target allocation. This framing is accurate but incomplete.
Rebalancing is not defensive. It is generative.
Here is what actually happens across a full market cycle:

The Second benefit — Volatility Harvesting:
Markets cycle. Assets alternate between above-average and below-average periods. A disciplined rebalancing practice systematically:
Sells the above-average performer
Adds to the below-average one
This converts the market's natural oscillation into a structural return advantage — over time, repeatedly, without requiring a single correct prediction about which asset will next outperform.
Rebalancing converts market movement into structural advantage. It is the mechanism through which structure asserts itself over noise.
Why Concentration Fails
Every significant portfolio failure has the same structural origin: too much capital in too few positions, without adequate protection against the specific risks those positions carry.
How concentration builds without being noticed:
Strong performers grow to dominate the portfolio by weight through appreciation, not deliberate addition
Conviction positions that were correct once become oversized over time
The reluctance to trim what has worked — emotionally, it feels like selling success — allows positions to compound their weight
By the time the concentration is clearly visible, the correction has often already begun.
The failure operates on two levels simultaneously:
Mathematically: A concentrated portfolio amplifies drawdowns. When 70% of the portfolio is in a single category that falls 40%, the portfolio itself falls roughly 28% from that position alone. Recovery from a 28% portfolio loss requires the entire portfolio to rise 38.9% from the trough.
Behaviourally: Concentration amplifies the emotional experience beyond what the mathematics describe. An investor watching 70% of their wealth fall 40% is not experiencing a manageable portfolio event. They are experiencing something that feels like financial destruction. At that level of emotional intensity, the probability of a destructive exit decision — selling near the bottom, refusing to re-enter — is extremely high. That exit converts a temporary mathematical drawdown into a permanent realised loss.
Four types of concentration risk:
Category concentration — single asset class dominates, amplifying drawdowns with no structural buffer
Theme concentration — dependence on a single investment narrative that markets will eventually reprice
Geographic concentration — vulnerability to regional economic cycles that may diverge from global trends for years
Time concentration — all contributions made at once, or all goals maturing simultaneously, creating liquidity risk that is entirely structural and entirely avoidable
Concentrated Portfolio | Structurally Diversified Portfolio | |
Portfolio weight | Single asset dominates | Multiple assets contribute meaningfully — none dominates |
Drawdown experience | Amplified by the weight of the concentrated position | Buffered by non-correlating positions holding through the correction |
Recovery dependency | Requires the concentrated asset to recover first and fully | Does not require any single asset to recover for overall recovery to begin |
Behavioural pressure | Peaks during corrections — entire outcome depends on one narrative | Manageable — some positions hold while others correct |
Consequence of a single wrong decision | Potentially catastrophic | Creates a setback, not a structural failure |
Time horizon flexibility | Single asset's cycle governs the entire portfolio | Different assets allow different time horizons to coexist within one structure |
Diversification as Outcome Stabilisation
Diversification is most commonly described as a risk-reduction tool. This framing, while accurate, understates what it actually does for the investor across a decade or more.
A more complete framing: diversification is an outcome stabilisation mechanism.
What it actually delivers beyond risk reduction:
What Diversification Does | Why It Matters |
Narrows the outcome range | Reduces probability of catastrophic underdelivery without capping upside proportionally |
Dampens journey volatility | Makes the portfolio genuinely holdable across market cycles |
Provides behavioural support | Non-correlating assets that hold value during corrections reduce the emotional severity of drawdowns |
Reduces narrative dependence | Portfolio does not require any single asset class, manager, or geography to be right |
Stabilises compounding | Smaller drawdowns mean less recovery required — compounding continues with fewer interruptions |

The connection to behavioural risk is direct. A portfolio that produces violent swings may be theoretically superior on a risk-adjusted basis. But if those swings exceed the investor's genuine behavioural capacity, the theoretical superiority is irrelevant. The investor will exit during the worst swing, miss the recovery, and end up with an outcome that is worse than a more conservative, more holdable portfolio would have produced.
Diversification does not reduce outcomes. It stabilises them — making the range of possible results narrower, the journey more manageable, and the probability of staying invested meaningfully higher.
One Portfolio, Multiple Goals — How Capital Sequences Across Simultaneous Objectives
This is where theory meets the reality of most investors' actual lives.
Most investors do not have one goal. They have several — running simultaneously, at different time horizons, with different risk tolerances, and occasionally competing for the same capital. A child's education in eight years. Retirement in twenty-five. A home in five. An ongoing contingency reserve. Aging parent support.
The mistake most investors make is treating all of these as a single portfolio problem. They are not. They are multiple portfolio problems that happen to share the same capital source.
The structural solution: capital sequencing across the Three Pillars, governed by the Monetary Layer
Every goal maps to a capital function. Every capital function maps to an allocation. The Monetary Layer — which governs how capital moves across the three pillars — is what allows a single investor to serve multiple goals simultaneously without structural conflict.
Goal | Time Horizon | Capital Function | Allocation Direction | Key Risk to Manage |
Emergency / Contingency reserve | Ongoing | Lending | Liquid, capital-safe instruments | Accessibility and cost of holding |
Home purchase | 3–5 years | Lending | Stable, predictable, debt-oriented | Capital preservation — avoid volatility near goal date |
Children's education | 7–10 years | Ownership transitioning to Lending | Balanced equity-debt blend, shifting conservative as date approaches | Sequence risk as goal date nears |
Retirement | 20–25 years | Ownership | Equity-heavy with progressive de-risking over time | Behavioural risk over long horizon, sequence risk in final 3–5 years |
Wealth transfer / generational | 25+ years | Ownership | Maximum equity orientation, long-term compounding | Concentration and structural drift over time |
How this changes portfolio construction in practice:
Capital earmarked for the home purchase in five years has no business being exposed to equity volatility — even if the overall portfolio is equity-heavy for retirement
Capital for retirement in twenty-five years has no business being held in low-return instruments because near-term goals created excessive caution in the overall allocation
The investor who conflates all goals into a single blended portfolio ends up with an allocation that is too aggressive for the near-term goals and too conservative for the long-term ones — serving none of them optimally
The Monetary Layer is what makes this workable in practice. It governs the movement of capital — from surplus income into each pillar, from one pillar to another as goals evolve, and from growth back into stability as goal dates approach. Without this operating layer, the three pillars would be static allocations. With it, they become a dynamic, self-adjusting system.
The practical framework:
Define each goal separately — amount needed, timeline, flexibility of timeline, consequence of shortfall
Assign each goal to its capital function — Lending for near-to-medium term goals and ongoing liquidity needs, Ownership for long-term compounding.
Allocate capital to each function in proportion to the goal's size, timeline, and required return
Review the mapping annually — as timelines shorten and goals are achieved, capital should migrate from Ownership toward Lending and eventually toward the Monetary Layer for deployment
This is not complexity for its own sake. It is the structural clarity that prevents near-term goals from being funded with volatile capital and long-term goals from being starved of compounding.
From Framework to Product Decisions
Everything in this series has been deliberately pre-product. Because the most consistent and costly error in investing is beginning at the product layer.
Most investors start here. They encounter a fund that has outperformed, a theme that feels compelling, a category that has run strongly. They select the product. And then, because it was chosen without a structural home, every subsequent decision becomes uncertain — when to hold, when to exit, what to expect, how it fits with everything else.
Products do not create outcomes. They express structure. A product selected without a structural purpose is not an investment decision — it is a speculation, regardless of how well-researched it appears.
The Decision Hierarchy
The correct sequence for any investment decision runs from outcome downward — never from product upward.

Every product decision that flows downward through this hierarchy has a clear structural purpose. It can be held through underperformance, evaluated against its role, and adjusted when conditions change — because its reason for being in the portfolio is defined by something more durable than its recent performance.
Every product decision that bypasses the upper levels is unanchored — and will be reversed when performance disappoints, which every product will experience at some point in its cycle.
Mapping Capital Function to Instrument
The VRFS Architecture of Money™ defines three pillars and one operating layer. Each has a natural instrument family that serves it best. This mapping is directional — specific instruments within each family change as market conditions, tax rules, and investor circumstances evolve. But the function-to-instrument relationship is durable even when the specific instrument changes.
Function | Primary Purpose | Instrument Family (Directional) | What to Evaluate |
Ownership | Long-run growth and wealth creation | Equity-oriented funds (large, mid, small, flexi cap), international equity, gold for long-term wealth preservation | Return range, time horizon alignment, manager quality and consistency, stress behaviour |
Lending | Predictable, contractual return | Debt funds across durations, fixed income structures | Credit quality of underlying, duration match to holding period, post-tax yield versus alternatives |
Enabling | Continuity and protection of the overall structure and operational capabilities. | Liquidity reserves, short-duration instruments, insurance structures, Operational Capabilities. | Accessibility, cost of holding, adequacy of coverage, speed of deployment when needed |
Monetary Layer | Capital in transit, settlement, and pre-deployment holding | Liquid funds, overnight funds, savings instruments | Capital safety, exit load structure, accessibility — return is secondary |
How to Evaluate Any Product
When a product is presented — whether independently discovered or recommended — the evaluation framework is consistent across all asset classes. Five questions, in sequence:
Question | What It Is Asking |
Function | Which capital function does this product serve? If unclear, it has no structural home. |
Behaviour | How has it behaved through previous stress periods? What is its realistic drawdown range and recovery time? |
Fit | Does its risk profile, return range, and liquidity match the needs of the capital it would receive? |
Constraints | What are the tax implications? Lock-in periods? Exit loads? Minimum sizes that affect position sizing? |
Placement | Where in the portfolio does it belong — and what does it replace, complement, or improve? |
A product that cannot be evaluated against all five questions has not been adequately analysed. A product that fails any one of them does not belong in the portfolio, regardless of recent performance.
Why Product-Led Investing Fails
The failure is structural, not incidental. When a product is selected first — before function, allocation, and outcome are defined — it is implicitly optimised for the conditions that made it attractive at the moment of selection. Those conditions change.
The rising rate environment that made short-duration debt attractive becomes a falling rate environment where longer duration wins
The domestic equity bull run that rewarded concentrated mid-cap exposure rotates into a period where large caps dominate
The infrastructure theme that attracted capital at peak optimism delivers disappointment as the cycle turns and valuations correct
The investor who selected products for structural reasons knows what to expect from each position and can hold through underperformance with genuine conviction — because there is a structural reason to believe the underperformance is temporary.
The investor who selected products for performance reasons has no such anchor. The exit seems rational in isolation. But the pattern — buying what is current, selling what has lagged — is the systematic destruction of compounding.
Context changes continuously. "Best" is always temporary. Only structure is durable enough to hold a portfolio through the full length of time that compounding requires.
Outcome Measurement — Is the Portfolio Actually Working?
This is the section most financial conversations skip. Returns are tracked. NAVs are monitored. CAGR is calculated. But the question that actually matters — is this portfolio on trajectory to deliver what the investor needs — is rarely answered with structural rigour.
Return is not outcome.
Return is an intermediate variable — useful, but incomplete on its own. The correct measurement is not "what is my return?" It is "what is my outcome trajectory, and am I on course?"
Return Tracking | Outcome Tracking |
What is my CAGR? | Am I on trajectory to reach my goal on time? |
Which fund outperformed? | Is my corpus growing at the required rate given contributions to date? |
How did I do vs the index? | Do I need to adjust contributions, timeline, or allocation? |
What did my portfolio return this year? | Have any structural breaks occurred that need to be corrected? |
Three scenarios that illustrate why return alone is insufficient:
A portfolio delivering 12% CAGR against a goal requiring 9% is ahead of trajectory — the investor has structural buffer
A portfolio delivering 9% CAGR against a goal requiring 12% is behind trajectory — action is needed now, not at the goal date
A portfolio delivering 15% CAGR in a strong market period may still be behind trajectory if contributions have been inconsistent or a significant behavioural exit interrupted compounding at a critical point

Three questions that frame outcome measurement correctly:
Am I on trajectory? Is the current corpus value, given contributions to date and time remaining, within the corridor that leads to the goal on time? If not — is the gap from market underperformance (may resolve), contribution shortfall (requires action), or structural misalignment (requires reallocation)?
Is my allocation still appropriate for the remaining time horizon? The equity weight correct at fifteen years from the goal is not automatically correct at five years. Risk that was appropriate when recovery time was abundant becomes inappropriate when the goal date is imminent.
Have any structural breaks occurred? SIP stoppages, premature redemptions, concentration drift, unplanned tax events — each creates a measurable deviation from trajectory. Identified early, correctable. Identified late, they compound into shortfalls that cannot be closed.
This series has focused primarily on the investment side of portfolio outcomes. But for most investors still in the accumulation phase, the contribution rate is an equally powerful — and often more controllable — lever than the investment return. In the early years, when the corpus is small, an increase in monthly contribution has a greater impact on the eventual outcome than an improvement in annual return.
A portfolio growing at 10% with consistent, increasing contributions will almost always outperform a portfolio growing at 13% with irregular, declining contributions. The structure of how much is invested, and how consistently, is as important as the structure of how it is invested.
Life Stage and the Evolving Portfolio
One element this series has treated as implicit deserves to be stated explicitly: the right portfolio is not the same at every stage of the investor's life.
Not because goals change — though they do. But because the variables that matter most — time horizon, income stability, risk capacity, liquidity needs, tax position — evolve continuously. A portfolio built correctly at thirty-two may be structurally misaligned at forty-eight if it has not evolved with the investor.
The four life stage phases and what each requires:

Phase 1 — Early Career: Growth orientation, contribution rate primacy
This is the phase where the compounding runway is longest and where contribution rate matters more than portfolio sophistication.
Time horizon is long — volatility is affordable and should be used, not avoided
Income is typically growing — increasing contribution rate over time has a disproportionate impact on eventual outcome
The Ownership pillar should be dominant — equity-heavy, long-term oriented, with only a basic Monetary Layer for liquidity
The primary risk is not market volatility — it is underinvesting during the years when compounding has the most time to work
Phase 2 — Mid-Life: Balance, increasing goal specificity
Goals become more specific and timelines more varied. A child's education approaches. A home has been purchased or is being planned. Retirement moves from abstract to calculable.
Multiple simultaneous goals require the goal-mapping framework described in Section 11
The Lending pillar begins to grow — near-term goals require stability that equity cannot reliably provide over short horizons
The Enabling function becomes meaningful — income protection, contingency sizing, and the structural buffers that protect the rest of the portfolio
Review cadence should increase — the portfolio is now more complex and more goal-specific
Phase 3 — Pre-Retirement: De-risking without abandoning compounding
The five to seven years before a major goal date — particularly retirement — is where sequence risk becomes the dominant structural concern.
Sequence risk is the risk that a significant market correction occurs in the years immediately before or after the transition from accumulation to distribution. Even if the long-run return is ultimately correct, a severe drawdown at the wrong point in the sequence can permanently impair the sustainable withdrawal rate.
The Ownership pillar should reduce progressively — not abruptly, not reactively, but as a planned structural evolution over five to seven years
The Lending pillar should grow to fund the first three to five years of withdrawal requirements — insulating them from equity market timing
The Enabling pillar becomes critical — liquid capital made available for early distribution needs, with the Monetary Layer governing its deployment without requiring long-term position liquidation..
Phase 4 — Distribution: The moment everything changes
This phase deserves its own full treatment — it is a series in itself. But its importance requires naming here clearly.
The transition from accumulation to distribution is not a gradual shift. It is a structural inversion. During accumulation, time is the investor's most powerful asset — every year of additional compounding increases the eventual corpus. During distribution, time works differently — every year of withdrawal reduces the corpus, and poor sequence in the early years of distribution can permanently alter the sustainable withdrawal rate.
The portfolio's objective shifts from maximising growth to sustaining withdrawals without depleting capital prematurely
The allocation must ensure that the equity portion — which continues to compound for the long-term portion of the corpus — is not forced to liquidate during corrections to fund near-term withdrawals
A structured distribution framework — with the Enabling pillar covering immediate needs, the Lending pillar funding near-term needs, and the Ownership pillar continuing to compound for longer-term needs, with the Monetary Layer governing the movement of capital across all three — is the architectural solution..
The full treatment of the distribution phase — sustainable withdrawal rates, portfolio sequencing in retirement, and the structural design of a distribution-phase portfolio — is a subject for a dedicated series.
The Review Framework — Maintaining the System
A portfolio is not a set-and-forget instrument. It is a system — and systems require maintenance to remain calibrated to their purpose. But there is an important distinction between maintenance that serves the portfolio and activity that disrupts it.
Two types of review — and what triggers each:
Routine Review (Annual) | Structural Review (Event-Triggered) |
Check actual allocation vs target — has drift occurred? | A significant life event: marriage, child, job change, income step-up, inheritance |
Assess whether rebalancing thresholds have been breached | A goal timeline change — goal brought forward or pushed back significantly |
Verify SIP continuity and contribution rate adequacy | A material regulatory or tax environment shift affecting the portfolio's structure |
Review post-tax return trajectory against goal trajectory | A major portfolio deviation — one allocation has grown to dominate through drift |
What to look for in a routine review:
Has the allocation drifted meaningfully from its target? If equity has grown from 60% to 68%, rebalancing is likely warranted
Is the portfolio on outcome trajectory? Use the goal trajectory framework, not CAGR in isolation
Have contribution rates kept pace with income growth? A fixed SIP amount in a growing income profile is a declining real contribution rate
Are there any positions that have grown to represent an outsized share of the portfolio without a structural reason?
What to ignore in a routine review:
Short-term performance relative to a benchmark or peer category
Recent performance of categories not currently held
Predictions about which asset class will outperform in the coming year
Market commentary that suggests a change to the structural allocation without reference to the investor's specific goals and time horizon
The cardinal principle of the review framework:
Activity is not the same as management. A portfolio reviewed routinely, rebalanced when thresholds are breached, and structurally revised only when the investor's life circumstances genuinely change — will almost always outperform a portfolio that is actively managed in response to market noise.
The Failure Modes of Portfolios
Understanding how portfolios fail is as important as understanding how they are built. The failure modes are consistent across investors, across wealth levels, and across market cycles. They are not exotic. They are ordinary — and that ordinariness is precisely what makes them so destructive. They are not recognised as failure until the damage is already compounding silently.
Failure Mode | How It Develops | What It Quietly Destroys | Early Warning Signs |
Wrong Allocation | Capital placed in the wrong function for its time horizon — assets behaving differently from expectations | Goal alignment and return quality | Persistent expectation mismatch, early exits triggered by normal asset class behaviour |
Wrong Time Horizon | Long-term capital treated as short-term, or near-term capital exposed to long-term volatility | Compounding capacity or stability, depending on the direction of the error | Forced redemptions at wrong cycle points, or excessive conservatism accumulating into a long-run shortfall |
Behavioural Breakdown | Exits during corrections, SIP stoppages, return chasing, delayed re-entry after volatility | The continuity of compounding — the only thing that makes long-term returns possible | Elevated portfolio activity during market corrections, increasing cash holdings during uncertainty |
Tax Inefficiency | Frequent switching, STCG accumulation, redemptions without planning, failure to use available exemptions | Net return retention — the only return that actually matters | Widening gap between gross portfolio performance and what the investor actually retains after tax |
Concentration | One position, category, or theme growing to dominate through appreciation or deliberate addition | The portfolio's ability to absorb stress without requiring destructive decisions | Any single position exceeding 30–35% of total allocation without a deliberate structural reason |
Each of these failure modes is detectable in advance — not with certainty, but with adequate probability — through the structural thinking this series has outlined.
The investor who has:
Defined allocation function clearly
Calibrated return expectations to realistic ranges
Managed taxation as a structural variable
Maintained behavioural discipline through cycles
Diversified genuinely across low-correlation assets
Reviewed and rebalanced systematically
...is structurally protected against all five failure modes simultaneously.
The investor who has not done this work is exposed to all five — not as bad luck, but as the inevitable consequence of structural gaps that create the conditions for failure before the first correction tests the portfolio's resilience.
The System View — Everything Comes Together
At this point, the three parts of this series can be seen as a single integrated argument. Not three separate frameworks — one framework, across three layers. Each layer builds directly on the one before it. Each is incomplete without the others.

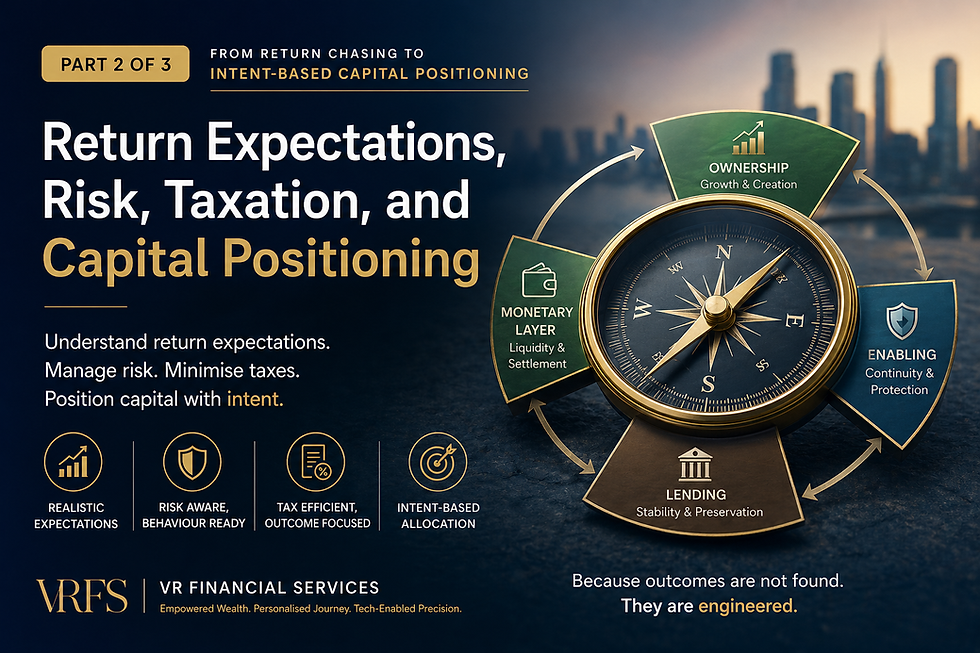
Part 1 established that a portfolio is a structured system, not a collection of products. The VRFS Architecture of Money™ defined three pillars — Ownership, Lending, and Enabling — and the Monetary Layer that governs how capital moves across them. The central principle: structure must precede selection. A product selected without a structural home is a speculation dressed in research.
Part 2 established how capital should be positioned within that structure. Return expectations must be realistic and range-based, because the expectations you carry shape your behaviour, and your behaviour shapes your outcome more than any product decision. Risk is primarily behavioural, not mathematical. Taxation is structural — post-tax, post-behaviour, real return is the only honest measure. Capital must be positioned forward-looking — toward what it needs to do next, not backward toward what recently performed.
Part 3 has established that allocation is the input, not the output. The output is the probability-weighted range of outcomes the portfolio will actually deliver, across the investor's real time horizon, under the full range of market conditions that horizon will contain. Outcome engineering — defining what the portfolio must deliver, measuring progress against that definition, evolving the structure as life stages change, and maintaining the system through a disciplined review framework — is what converts a structurally sound allocation into a result that actually serves the investor's life.
A portfolio with structure but without positioning is a framework without judgment.
A portfolio with positioning but without outcome clarity is a vehicle without a destination.
A portfolio with all three — structure, positioning, and outcome engineering — is what most investors never quite build, despite years of sincere effort and active engagement with their money.
That gap is not a failure of intelligence or effort. It is a failure of framework — of the way most financial conversations are structured, which is product-first, return-focused, and largely disconnected from the investor's actual goals, actual time horizon, and actual capacity for the journey.
Final Conculsion - Outcome Engineering, Not Guessing
This series began with a question most investors have never been asked with structural intent:
What is your portfolio actually designed to do?
Not which products it holds. Not what return it delivered last year. Not which category is currently running. But what it is genuinely, structurally, deliberately designed to deliver — for whom, by when, under what conditions, and with what probability.
The honest answer, for most investors, is that no one asked this question when the portfolio was built. Capital accumulated one product at a time, one recommendation at a time, one market cycle at a time. The structure was never the starting point — because the question that would have established the structure was never asked.
This series has argued, across three parts, for one foundational shift in how investing is approached:
Capital has functions — Ownership, Lending, and Enabling — and the Monetary Layer governs how it moves across them. Each function must be filled deliberately, not accidentally.
Return expectations must be range-based and honest — because the expectations you carry determine your behaviour, and your behaviour determines your outcome more than your product selection ever will.
Risk is not primarily a number — it is an experience, managed by building a structure the investor can genuinely hold through its worst periods.
Taxation is structural — post-tax, post-behaviour, real return is the only honest measure of what a portfolio delivers.
Allocation is the input — outcome engineering is the discipline of understanding, measuring, and navigating toward a defined destination across the full arc of the investor's life.
Diversification is not risk reduction alone — it is outcome stabilisation, the structural mechanism that makes staying invested psychologically possible.
Rebalancing is not maintenance — it is the engine through which structure is enforced and market volatility is converted into advantage.
Products are the final layer, not the first — a product selected without a structural purpose has no defensible position in the portfolio.
Life stage changes everything — the portfolio must evolve deliberately as time horizons shorten, goals crystallise, and the transition from accumulation to distribution approaches.
The review framework is what keeps the system alive — routine maintenance versus structural revision, and the discipline to know the difference.
None of this requires prediction ability. None of it requires access to information that most investors do not have. None of it requires exceptional sophistication.
It requires a framework. And the discipline to apply it with patience — across the natural cycles of every asset class, across the full length of time that compounding needs to do its work, and across the inevitable periods when the structure feels unnecessary because everything is going well, and the periods when it feels insufficient because nothing is.

Because in the end, the investor who builds with structure, positions with judgment, maps to outcomes, sequences across goals, evolves through life stages, and holds through the inevitable difficulty of markets moving unpredictably — that investor will not always have the highest-performing portfolio in any given year.
But across a decade. And across two decades. And across the full arc of a financial life:
They will have built the most complete one.
One that delivered not just returns, but outcomes. Not just performance, but the life those returns were always meant to fund.
This concludes the three-part series on Asset Allocation by VR Financial Services.
Part 3 — From Allocation to Outcome Engineering
Framework Reference
The capital flow, instrument selection, and allocation principles discussed in this section are derived from the VRFS Architecture of Money © (AoM), Architecture of Instruments © (AoI), and Architecture of Capital © (AoC), together forming the VRFS Wealth Operating System (WOS). This integrated framework structures capital across the three pillars — Ownership, Lending, and Enabling — with the Monetary Layer governing capital movement across them, aligns instruments to their underlying economic role, and positions capital forward-looking based on intent, flow, and outcome.
Developed by Rajeev Roshan R, Principal and Founder of VR Financial Services.
This concludes the three-part series on Asset Allocation by VR Financial Services.
VR Financial Services
Empowered Wealth. Personalised Journey. Tech-Enabled Precision.
VR Financial Services, based in Bengaluru and founded in 2019, is a founder-led financial distribution firm. We help individuals, families, businesses, and trusts access financial products and build structured portfolios with greater clarity, discipline, and convenience.
What We Offer
End-to-end access to financial products across mutual funds, NPS, fixed deposits, bonds, insurance, and more
Seamless digital execution with consolidated portfolio tracking and reporting
Research-backed insights, portfolio monitoring tools, and performance reporting
Life and general insurance solutions to support protection needs across different life stages
Liquidity support options, including loans against mutual funds and other eligible assets
Our Approach
We go beyond product access by helping clients build structured financial systems that can adapt over time.
Our approach is:
Structured and goal-oriented, so portfolios can evolve with changing life stages and market cycles
Built around Core + Satellite frameworks that support both stability and flexibility within portfolios
Transparent and technology-enabled, making execution, tracking, and monitoring more efficient
Focused on disciplined allocation, long-term thinking, and consistent portfolio management rather than short-term market movements
At VR Financial Services, we believe wealth is not built by reacting to every market movement, but by having the right structure, product mix, and execution framework in place over time. Our role is to help clients stay prepared, stay invested, and stay aligned to their financial objectives.
Empowered Wealth. Personalised Journey. Tech-Enabled Precision.
🔗 LinkedIn – VR Financial Services
Disclaimer:
Mutual Fund investments are subject to market risks. Please read all scheme-related documents carefully before investing. The information shared by VR Financial Services is for educational and informational purposes only and should not be considered a recommendation or an offer to buy or sell any financial product. Past performance is not indicative of future results. Investors must ensure KYC compliance through authorised intermediaries, conduct their own due diligence, and make informed decisions. VR Financial Services does not guarantee returns or offer fixed/assured return schemes—any such claims are misleading and prohibited by SEBI. All investment transactions must be carried out only through official channels, and investors should never share personal credentials or OTPs. We do not solicit funds or commitments via social media, which is used strictly for investor awareness and education.